
An updated version of this post is here: What the Millionaires Tax would mean for Washington
Among opponents of Washington’s proposed Millionaires Tax(opens in new tab), there’s a lot of political teeth-gnashing about the size of the state’s budget. While I’m not a dentist (more of a numbers nerd), I do want to help save those pearly whites – or at the very least protect you, dear reader, from possible teeth-gnash-inducing claims you might hear in the weeks ahead as lawmakers debate this historic legislation. You might say this post is a “state budget night guard” of sorts.
But enough with the metaphors – let’s get to the numbers.
One crucial piece of context for the state’s budget – and the debate over the Millionaires Tax – often goes missing: Overall, Washington state is wealthier than ever. From 1995 to 2025, total personal income (that’s all the money everyone living here receives in a year from salaries, wages, rental and investment income, etc.) grew by 170%, adjusted for inflation, from $265 billion to $713 billion.[1]
Now, you might think that with all that additional wealth, our state would easily be able to keep up on important investments in public structures and services – like high-quality public education, ample child care, affordable health care, and more housing options for families. You know, the things that make life better.
However, that is not the case.
Relative to income and population growth, Washington’s budget has actually declined by 60% overall. From 1995 to 2025, the state’s yearly operating budget shrank from 1.55% to 0.63% of total personal income for every one million residents (adjusted for inflation).[2]

Put another way, even though the state’s yearly budget grew from $22 billion to $37 billion (adjusted for inflation) over the past 30 years, it didn’t keep up with our state’s capacity to invest. How much have we lagged? Well, if we’d maintained 1995 spending levels relative to total personal income, Washington’s operating budget would have been nearly $90 billion in 2025.
Instead, spending has declined by 61% in K-12 education (from 0.70% to 0.27% of total personal income per 1M residents); 68% in higher education (from 0.17% to 0.05%); and (since 1998) by 44% in social, health, and human services (from 0.43% to 0.05%).
Why haven’t we kept up the investments in public structures and services that we know help build stronger and healthier kids, families, and communities in Washington? It’s a two-part answer.
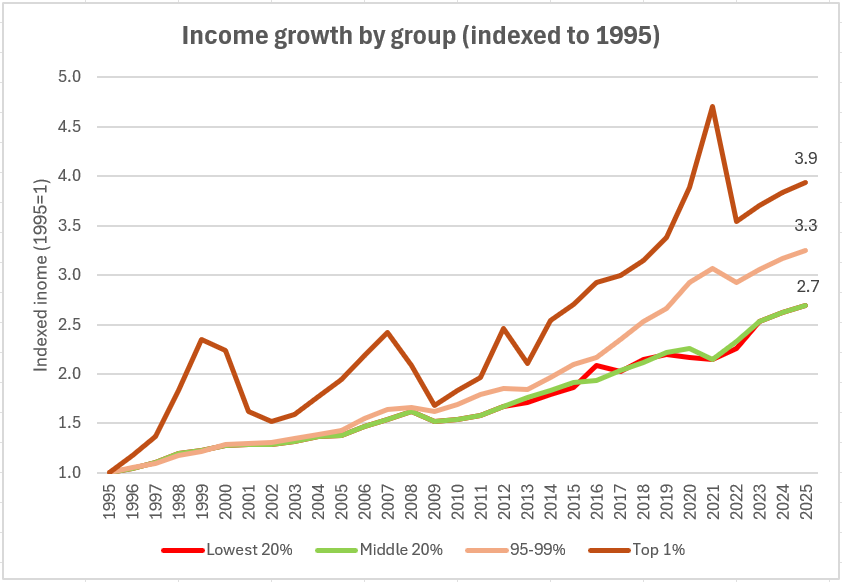
First, the bulk of income growth in our state has gone to those at the top. While total income has increased overall, it has not done so equitably: The share for those at the top has grown far more than for everyone else. From 1995 to 2025, total income for the top 1% nearly quadrupled – growing to 3.9 times 1995 levels – while income for the middle and bottom 20% grew by 2.7 times.[3]
Second, Washington’s tax code asks too little of those who can afford to pay the most. In this state, the lower you are on the income spectrum, the more you pay in state and local taxes. In 2025, the top 20% in Washington received nearly 59% of total state income and paid an average of just 6.1% in state and local taxes. The bottom 80% received just over 41% of state income and paid an average of 10.5% in state and local taxes. [4],[5]
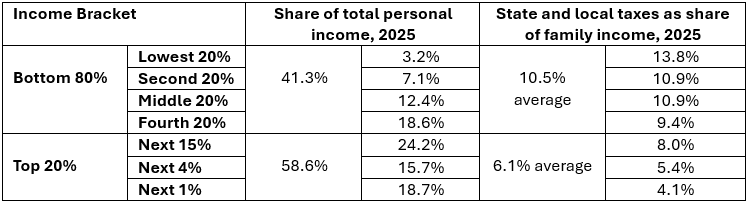
Washington’s upside-down tax code is a double whammy. Lower rates on high-income households reduce available state revenue, and higher rates on low-income households make them foot more of the bill.
State spending should account for both total personal income and population, because that’s what drives our ability to make investments in the public goods and services that create economic opportunity and support our communities. By making our tax code more equitable, a millionaire’s tax will help make that possible.
Do I still hear molars grinding to my right? Feel free to argue your philosophical opposition to the idea of government generally. Just know it’s disingenuous to say Washington can’t afford to spend more, because clearly, we once did – and at a time when we weren’t nearly as well off as we collectively are today.
[1] U.S. Bureau of Economic Analysis, “SAINC1 State annual personal income summary: personal income, population, per capita personal income(opens in new tab)“. Inflation-adjusted using Chained CPI-U extended with CPI-U-RS, CPI-U-X1, CPI-U via Economic Policy Institute, State of Working America Data Library, “Price indexes – Extended chained CPI-U (Base = Dec 1999)”.
[2] WA State Fiscal Information (fiscal.wa.gov(opens in new tab)) and yearly budget data provided by WA State Office of Financial Management. Inflation-adjusted using U.S. Bureau of Economic Analysis, “Table 1.1.9. Implicit Price Deflators for Gross Domestic Product(opens in new tab)“, Government consumption expenditures and gross investment, State and local government.
[3] Source: IRS Statistics of Income (2013–2022)(opens in new tab), Frank–Sommeiller–Price state income inequality series (opens in new tab)(1995–2012; 2023–2025), and U.S. Bureau of Economic Analysis, “SAINC1 State annual personal income summary: personal income, population, per capita personal income(opens in new tab)” (accessed Thursday, February 12, 2026). Earlier and recent years are harmonized to IRS definitions and converted into quintile shares using a consistent interpolation method. Note: Because pre-2013 and post-2022 estimates rely on harmonized tax-based top income shares and assume a stable lower- and middle-income distribution based on 2013–2019 IRS data, results should be interpreted as approximations of the full distribution rather than direct tabulations for those years.
[4] Ibid.
[5] Institute on Taxation and Economic Policy, “Washington: Who Pays? 7th Edition(opens in new tab)”.