
Key Takeaways
- State spending has grown far more slowly than the overall economy given the number of people served.
- Washington state’s taxes require too little of those with the highest incomes.
- The Millionaires Tax is a chance to do something better for Washington.
With voters set to weigh in on Washington’s historic Millionaires Tax this fall, this is a good time to give some much-needed context for the upcoming debate.
State spending has grown far more slowly than the overall economy given the number of people served
Understanding state spending requires accounting for three key factors:
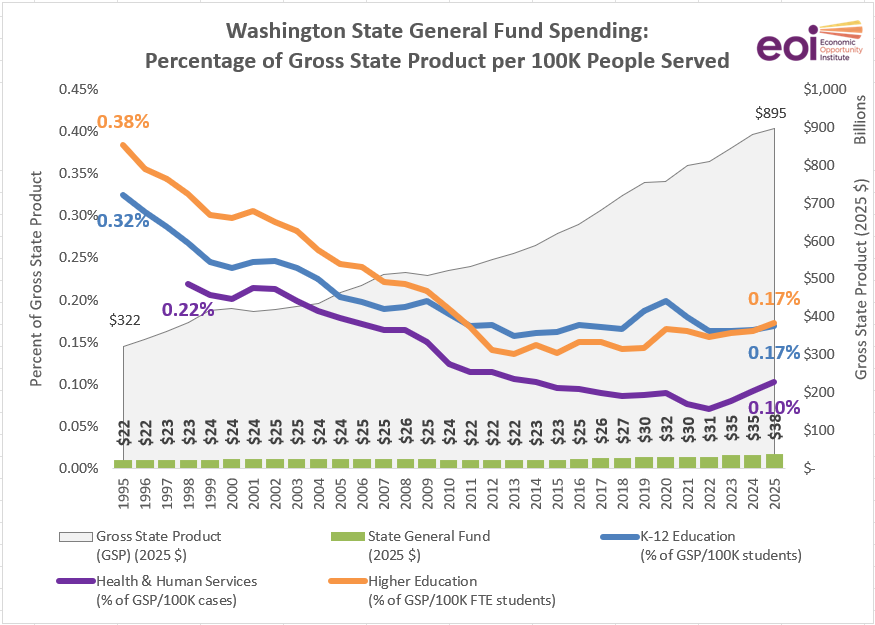
1. The size of the state budget. While the state’s total operating expenditures from all sources is $166 billion(opens in new tab) for the 2025-27 biennium, the governor and legislature have the most discretion over what’s called the “state general fund”, which totals about $73 billion(opens in new tab) for the same period. (Much of the rest is federal or other non-discretionary spending.) Adjusted for inflation to 2025 dollars, Washington’s yearly total general fund operating budget grew 71% from 1995 to 2025: from ~$22 billion to ~$38 billion.[1]
2. The size of Washington’s economy. Economists commonly measure public spending as a percentage of the overall economy because a dollar amount by itself can be misleading: a large or growing economy can support more spending than a small one. Measuring spending against the overall economy makes it easier to compare different years and understand how much of the economy’s resources are being directed through government.
In this case, Gross State Product (GSP), which measures the market value of all goods and services produced by labor and property in a state, is what we’re after. Adjusted for inflation to 2025 dollars, Washington’s GSP grew by 178% between 1995 and 2025: from $322 billion to $895 billion.[2]
3. The number of people being served. One thing often lost in budget debates is that public dollars serve actual, real-life human beings. K-12 education, social and human services, and higher education make up about 90% of the state’s general fund expenditures(opens in new tab). To accurately represent general fund spending, we also have to account for population directly served by those core budget areas, which grew 21% overall between 1995 and 2025: from ~2.4 million to ~2.9 million people.[3]
Bring those three factors together (divide general fund spending by GSP and express it per 100K people), and the trend is clear: Relative to the size of the state’s economy and the number of people served, Washington’s general fund spending has declined substantially over the past 30 years.
Sources: Washington State Office of Financial Management, U.S. Bureau of Economic Analysis
In the mid-90s, Washington’s general fund budget was equivalent to nearly 1% of the state’s GSP per 100,000 people served: 0.32% per 100K students in K-12 education, 0.38% per 100K students in higher education, and 0.22% per 100K cases in health and human services.
But as of 2025, we’re investing the equivalent of less than one-half of 1% of our GSP in those same three areas: 0.17% per 100K students in K-12 education (48% less), 0.17% per 100K students in higher education (55% less), and 0.10% per 100K cases in health and human services (53% less).
Washington’s taxes require too little of those with the highest incomes
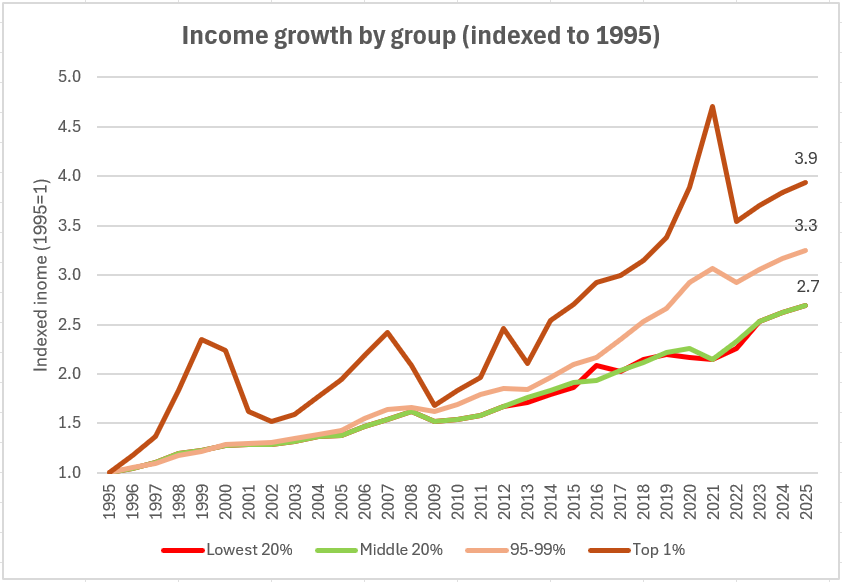
Washington’s economy has grown tremendously over the past 30 years. Yet most of the benefits of that growth have gone to the top 1% of households, whose incomes have far outpaced everyone else.
From 1995 to 2025, total income for the top 1% of households in Washington nearly quadrupled – growing to 3.9 times 1995 levels – while income for the middle and bottom 20% grew 2.7 times.[4]
Sources: IRS Statistics of Income 2013-2022, Frank-Sommeiller-Price state income inequality series (1995-2012, 2023-2025, U.S. Bureau of Economic Analysis personal income summary
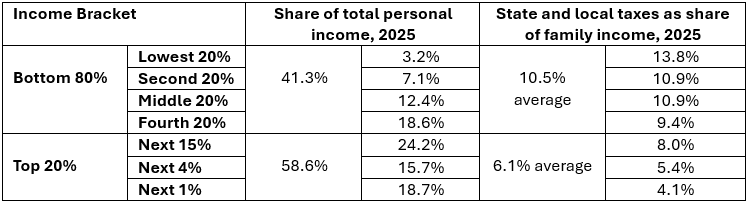
And over those 30 years, the state’s tax structure hasn’t fundamentally changed. State revenue still relies too heavily on sales and property taxes. As a direct result, low- and middle-income households pay a far higher share of their income in state taxes than high-income households do.
In 2025, the top 20% in Washington received nearly 59% of total state income and paid an average of just 6.1% in state and local taxes. The bottom 80% received just over 41% of total state income and paid an average of 10.5% in state and local taxes.[5] [6]
Sources: IRS Statistics of Income 2013-2022, Frank-Sommeiller-Price state income inequality series (1995-2012, 2023-2025, U.S. Bureau of Economic Analysis personal income summary, Institute on Taxation and Economic Policy.
It’s a double-whammy: by under-taxing high-income households, the state’s tax code reduces available state revenue; by overtaxing low- and middle-income households, the people who can least afford it foot more of the bill for public services. This is part of why Washington’s tax revenue perpetually falls short of what is needed.
It doesn’t have to be that way.
The Millionaires Tax is a chance to do something better for Washington
In 2026, a majority of state legislators approved legislation that enacts a Millionaires Tax on income above $1 million and reduces taxes on low- and middle-income households.
Under the Millionaires Tax, income above $1 million will be taxed at a rate of 9.9%. For example: If you were paid $1,000,100, you would owe $9.90 (because the first $1 million isn’t taxed). Deductions and credits for business pass-through income and capital gains income ensure there’s no double taxation. Home sales aren’t taxed, and neither are financial assets nor net worth.
IRS data from 2022 (the latest available) shows about 21,500 households in Washington reported over $1 million in annual income – meaning 99% of Washington households won’t owe anything under the Millionaires Tax. In fact, thanks to the legislation’s expansion of the state’s Working Families Tax Credit and elimination of sales taxes on several categories of items, 95% of Washington households will pay less in state taxes, according to an analysis by the Institute on Taxation and Economic Policy(opens in new tab):
The Millionaires Tax will generate an estimated $3 to $4 billion annually for Washington’s general fund – which, as noted above, devotes nine out of every 10 dollars(opens in new tab) to K-12 education, child care, health care, higher education, housing, and other core services.
A final note: It’s worth remembering that the state’s budget is a public tool used to pay for community needs that are too complex – or simply economically or logistically infeasible – to accomplish as individuals. Those investments are the foundation for our shared economic future and quality of life.
In other words, the correct question about the state budget is not: what’s in it for me? It is: what is in it for us?
Maybe you don’t have kids – but all children need and deserve a good education, which is why a big part of the state’s budget supports kindergarten through college.
Maybe you have health insurance – but not everyone (especially those in low-wage work) is so lucky. So, Apple Health, the state’s Medicare program, is another big-ticket item.
Maybe you’re young. But time is a great equalizer. Aging and long-term support for seniors is part of Washington’s budget too.
You get the idea. The kinds of public investments supported by the Millionaires Tax will make life better for residents of our state today – and that is what helps unlock the door to economic growth and broad-based prosperity in the future.
Note: This is an updated and expanded article based on a previous EOI publication.
[1] WA State Fiscal Information (fiscal.wa.gov(opens in new tab)) and yearly budget data provided by WA State Office of Financial Management. Inflation-adjusted using U.S. Bureau of Economic Analysis, Table 1.1.9. Implicit Price Deflators for Gross Domestic Product(opens in new tab), Government consumption expenditures and gross investment, State and local government.
[2] U.S. Bureau of Economic Analysis, SAGDP2N Gross domestic product (GDP) by state 1(opens in new tab). Inflation adjusted using Table 1.1.9. Implicit Price Deflators for Gross Domestic Product(opens in new tab)”, Gross Domestic Product.
[3] Washington State Office of Financial Management, Budget drivers, “https://ofm.wa.gov/data-research/washington-trends/budget-drivers/(opens in new tab).
[4] Source: IRS Statistics of Income (2013–2022)(opens in new tab), Frank–Sommeiller–Price state income inequality series(opens in new tab) (1995–2012; 2023–2025), and U.S. Bureau of Economic Analysis, “SAINC1 State annual personal income summary: personal income, population, per capita personal income(opens in new tab)” (accessed Thursday, February 12, 2026). Earlier and recent years are harmonized to IRS definitions and converted into quintile shares using a consistent interpolation method. Note: Because pre-2013 and post-2022 estimates rely on harmonized tax-based top income shares and assume a stable lower- and middle-income distribution based on 2013–2019 IRS data, results should be interpreted as approximations of the full distribution rather than direct tabulations for those years.
[5] Ibid.
[6] Institute on Taxation and Economic Policy, “Washington: Who Pays? 7th Edition(opens in new tab)”.