
Over the past three decades, Washington’s workforce has become increasingly older, more diverse, and more likely to have a four-year college degree.
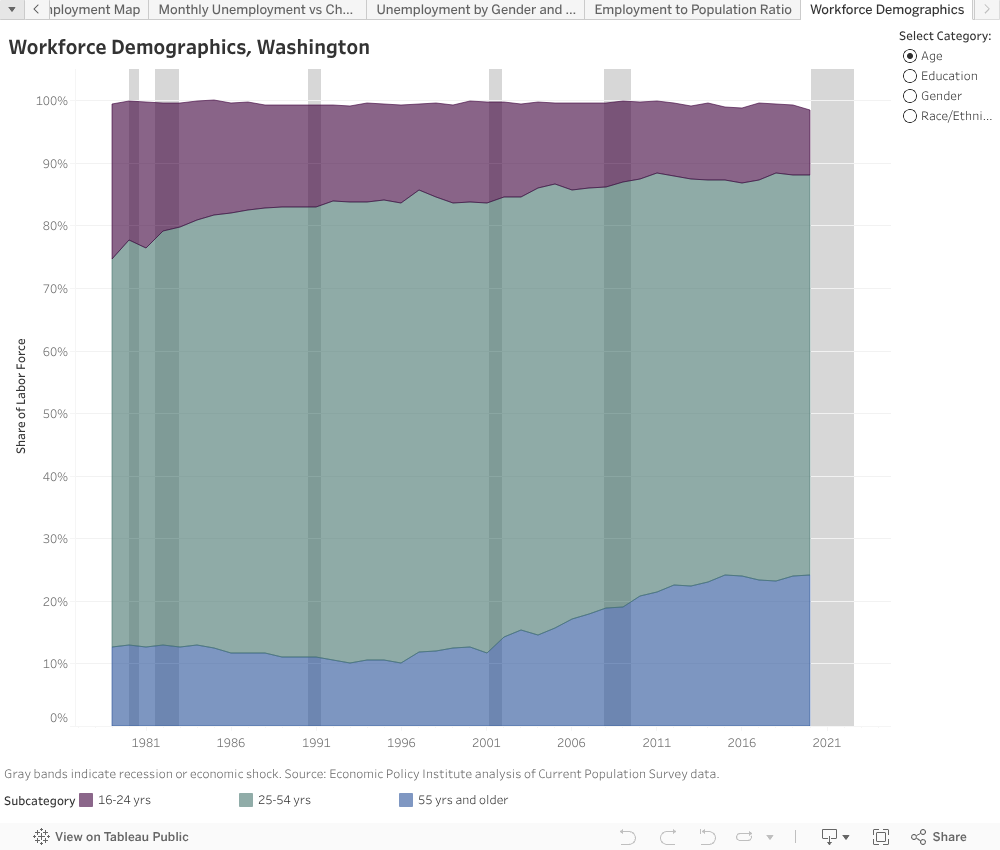
Age
The share of younger people (age 16-24) in the workforce is less than half what it was in 1979, while the share of older workers (age 55+) has nearly doubled. Two big factors are at work here: One, baby boomers, who represent large segment of the state’s population, are aging. And two (as we’ll see below), young people are staying out of the workforce longer, often in order to pursue additional education.
Diversity
White workers represented more than 9 in 10 people in state’s workforce through the mid-1990’s — today, they make up about two-thirds. The change has been driven largely by growth in the share of workers with Hispanic and/or Asian/Pacific Islander heritage.
Education
People with a high school diploma (or less) comprised more than half of the state’s workforce in 1979, and 1 in 5 had at least a four-year degree. As of 2018, just one-third percent of workers have a high school diploma or less, and nearly 2 in 5 have at least a four-year degree. Over the same period, the share of workers with some college peaked at 36 percent in the year 2000, and has since declined to 29 percent as of 2018 — roughly the same share as in 1979.
Gender
Between 1979 and 2000, the share of women in the workforce increased from 42 to 47 percent, and has held steady since. While there has been a slight decline over the past two years, it’s too soon to say whether that’s a temporary shift or part of a longer-term trend.
More To Read
State of Working Washington
August 10, 2021
New State Programs May Ease a Short-Term Evictions Crisis, but Steep Rent Hikes Spell Trouble
State and local lawmakers must fashion new policies to reshape our housing market
State of Working Washington
November 20, 2020
We Can Invest in Us
Progressive Revenue to Advance Racial Equity
Jackie
I am interested in the demographics of specific positions in Washington state (workforce availability as a function of race and job), similar to that published by the US Census Bureau (currently unavailable). Do you have such a thing? I am specifically interested in the availability of workforce by race for positions in K-12 education. Thank you.
Sep 23 2020 at 3:36 PM
Aaron Keating
Hi Jackie, you can find some of this data (not down to specific jobs, but for K-12 workforce only) by going to the Census data extraction page for Quarterly Workforce Indicators: https://ledextract.ces.census.gov/static/data.html. Check “Washington” as the geographic area, “NAICS 4-digit Industries” for firm characteristics (then select 6111 Elementary and Secondary Schools), “Race and Ethnicity” for worker characteristics (then tick the boxes for the racial groups you are interested in), “EmpS Full-Quarter Employment (Stable): Counts” for indicators, then the quarters and years for which you want this data. After clicking “Submit Request” you’ll be able to download the data in CSV format. It will take a bit of “translation” from the codes used by the Census to plain language, but you’ll have the data.
Sep 30 2020 at 3:36 PM